Projects
Featured Work
Power BI
Completed
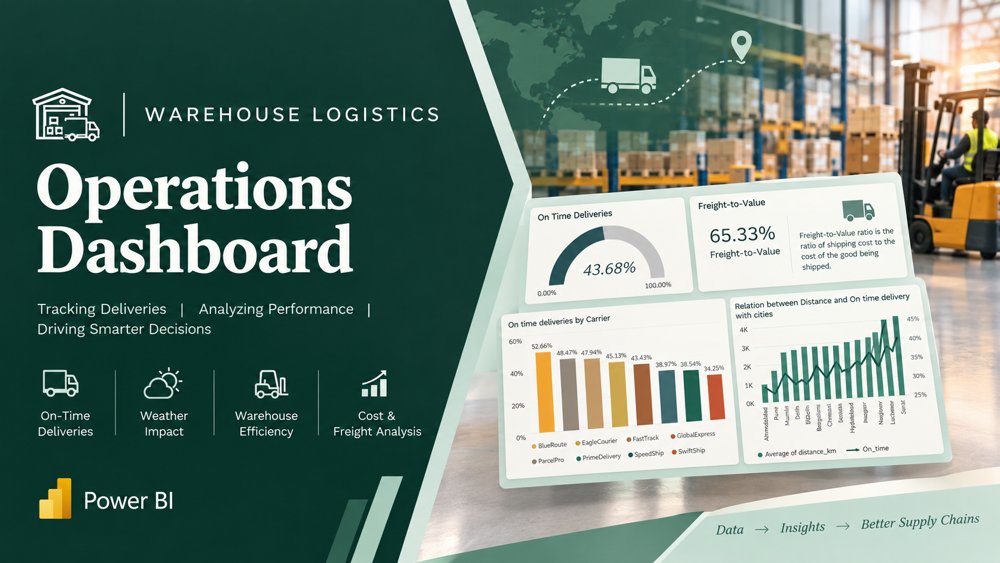
Warehouse & Logistics Cost Optimization
Analysed ~50,000 e-commerce orders to isolate the real drivers of late deliveries and evaluate whether freight cost trade-offs justify keeping the worst-performing carrier.
- Weather is the strongest driver of on-time delivery (65% in clear conditions vs. 6.5% in snow) — quarter and warehouse ID were tested and ruled out.
- Freight-to-value ratio is flat (~65%) across every carrier — the worst-performing carrier isn't cheaper, so there's no cost trade-off justifying its use.
Tableau
Completed
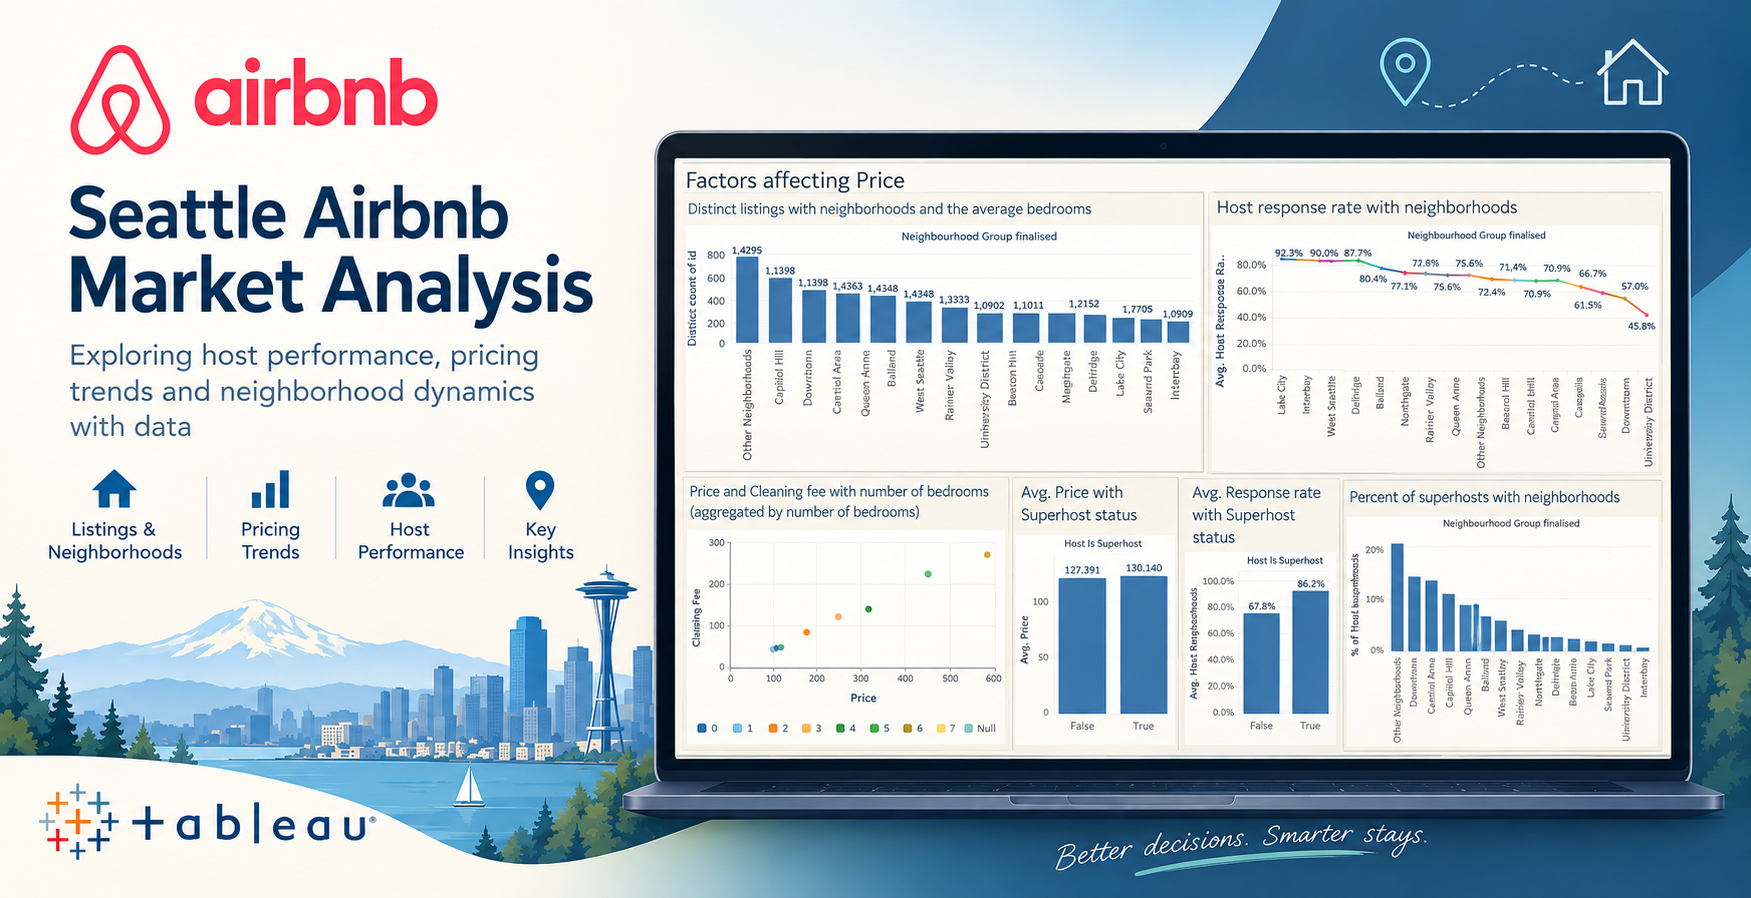
Seattle Airbnb Analysis
Analysis on the Seattle Airbnb dataset exploring host performance, pricing trends, and neighborhood dynamics.
- Superhost status barely moves price (~2% difference) but strongly predicts host response rate (~18-point gap) — consistent with response rate being one of Airbnb's actual criteria for superhost status.
- Magnolia has the highest average price despite a below-average superhost % and response rate, driven instead by having the highest average number of bedrooms of any neighborhood.
Python
Completed
LEGO Set Clustering Analysis
Clustered 18,600+ Rebrickable LEGO sets by release year and part count using K-Means, applying a Standard Scaler to normalize the axes and the Elbow method to determine the optimal number of clusters.
- LEGO's growth comes from expanding across product tiers (small to 5,000+ part mega sets) released concurrently, not from sets simply growing bigger over time.
- 2022 was excluded from the analysis due to incomplete data — extrapolated from a sharp, isolated drop in set count that year relative to the surrounding trend.

Looking for something lighter? See the Pokémon project and a bit more about me →